How to read, clean, and document your HubSpot data model like a working admin.
How your current HubSpot data model is actually behaving
Inherited portals tell the truth faster than strategy decks
Most RevOps folks don't get to start fresh. You inherit a HubSpot portal that's been through three admins, two agencies, and a "quick" sales ops experiment that never got rolled back. The objects look familiar, but the way data actually behaves doesn't match anyone's deck from the last offsite.
The first signal is usually reporting. Pipeline numbers don't line up with finance, marketing attribution slides get quietly dropped from QBRs, or nobody trusts the "active customers" report. None of that is a dashboard problem. Your data model is telling you it no longer matches how the business really works.
When we step into these portals — either for a fresh implementation or a rebuild under Data Architecture & Analytics engagements — the pattern is consistent. Standard objects are doing too many jobs. Properties were added to unblock a single project and never cleaned up. Associations grew organically rather than by design.
Look for the symptoms, not the theory
You don't need to be a data architect to read a HubSpot data model. You do need to pay attention to a few concrete symptoms:
- Property sprawl — dozens of fields with near-duplicate names, or fields nobody can explain
- Association overload — contacts linked to five companies, deals floating without a company at all
- Workarounds in spreadsheets — teams exporting data weekly because "it's easier to see the truth in Excel"
These are diagnostic signals that the object/property split is off. If renewals live partly on Deals, partly on Companies, and partly in a "renewals tracker" sheet, your model isn't wrong in theory. It's wrong in practice.
Accept that the model reflects politics, not just process
In mid-market companies, the data model is part diagram, part history book. Old initiatives leave scars: custom objects introduced for a single enterprise deal, fields created to satisfy one exec's dashboard request, abandoned integration experiments. Pretending everything is rational design will just slow you down.
Instead, start from: What's the least invasive way to make this model honest again? Sometimes that means sunsetting a custom object and pulling its key fields back onto Companies. Sometimes it means admitting that contracts or locations really do deserve their own records and treating your current long-text fields as migration inputs.
At Pivot, we treat an inherited data model like an archaeological site. We're not here to judge the last admin. We're here to figure out what rules the system has been running on, and what needs to change so RevOps can answer real questions again.
A practical way to map standard vs. custom properties
Start by profiling the properties you actually use
Most admins start with the question: "Do we need a custom object?" The better starting point is: "What are we actually using today?"
HubSpot's Data Quality tool is the fastest way to answer that question. Under Data Management → Data Quality → Property Insights, you'll find a Properties to Review panel that flags every property with no data, no usage in workflows or reports, or duplicate definitions. For each property, you can see the fill rate, the last update source, and where the property is referenced. It's the inventory your team would have built manually — already built for you.
A few things worth knowing about Property Insights:
- Filter by issue type — No data, Unused, Duplicate. Start with No data + Unused to surface the obvious dead weight.
- Run through every object type — Contacts, Companies, Opportunities, and Tickets each get their own tab. Do them in order. Contacts and Companies usually have the worst sprawl in inherited portals.
- Monitor properties for anomalies — The Monitor New Property feature watches a property for unexpected spikes or drops in update volume. Useful for catching the day an integration starts overwriting a field it shouldn't be touching.
If you don't use anything else from this post, spend 20 minutes inside Property Insights. You'll usually find that 30–50% of properties are effectively dead weight — and the tool will tell you exactly which ones.
Build your opinionated keep-list
For a mid-market team, you don't need a full data catalog. You need a short, opinionated list of properties that are non-negotiable for operating the business. That usually includes:
- Lifecycle fields — like lifecyclestage and dealstage
- Commercial data — amount, annual_contract_value, renewal_date
- Segmentation basics — industry, segment, product_tier
Everything else is either a helper field or a candidate for cleanup.
Once you've got that inventory, group properties by their job:
- Identity and keys — domain, company_id_in_erp, customer_number
- Commercials — ARR, contract term, renewal dates
- Engagement — last activity dates, product usage, marketing engagement
- Ops-only helpers — booleans you use purely for workflows and lists
The mess usually isn't that you have too many properties. It's that you have no shared mental model for what they're for. The Data Quality tool can tell you which properties exist and how they're used. It can't tell you whether they should exist. That's the conversation worth having with Sales, CS, and Finance after you've run the inventory.
Distinguish attributes from related records
The biggest conceptual error we see is trying to cram related records into a single property. If you have a long-text field on Company that reads like "Contracts: Master 2023–2025, Addendum 2024, Renewal 2026," you're hiding rows inside a cell. Reporting will always feel wrong, and any integration will be brittle.
A simple rule of thumb: if you find yourself wanting to sort, filter, or count "things inside the field," you probably want a separate object linked by associations, not more clever property naming. Contracts, locations, installed equipment, implementation projects — those want to be their own records.
Write down the source of truth for each fact
Once you've cleaned up the obvious sprawl, decide where each important fact lives:
- Revenue lives on Deals (and line items, if you're using them)
- Firmographic truth lives on Companies
- Person-level truth lives on Contacts
- Implementation state might live on a custom implementation_project object
When you violate this on purpose, write it down.
At Pivot, we do this as a one-page "data contract" for every data architecture engagement. It's not fancy — just a table with the business question, where we query it, and which properties matter. The discipline matters more than the format. It keeps everyone from quietly rebuilding the same metric three different ways in three different dashboards.
Turning your ERD into rules admins and teams can live with
Document just enough to survive turnover
An ERD no one can find is a nice artifact and a bad operating practice. Aim for documentation that a new admin can use to avoid breaking things in their first 90 days.
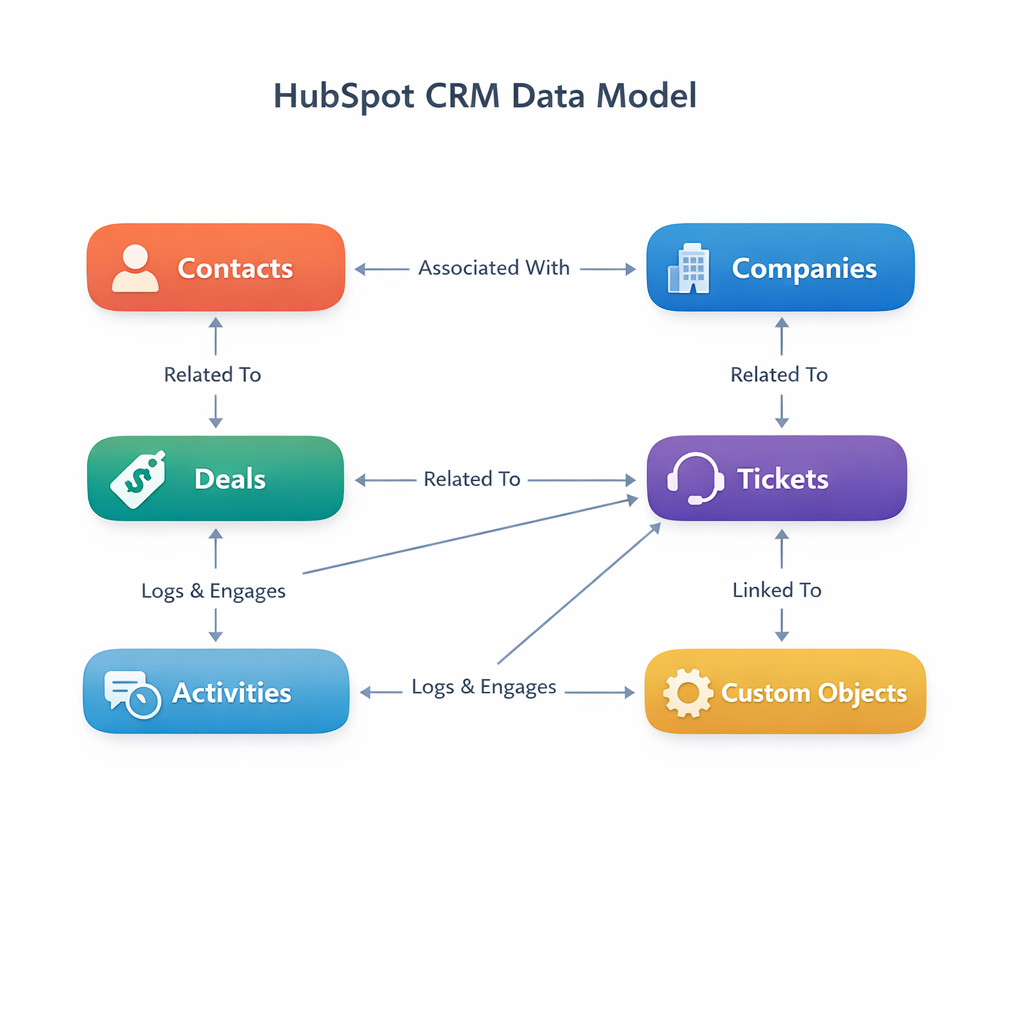
That means two layers: a visual map for context, and a written set of rules for how to extend the model. The visual can be a simple diagram that shows standard objects, custom objects, and the key associations between them. The written rules cover things like:
- When to add a property vs. a new object — including a few concrete examples
- Naming conventions — hs_ reserved for HubSpot, revops_ for internal helper fields, how you name booleans
- Approval paths — who decides when a new object is justified
This doesn't need to be a wiki maze. A single page in your internal handbook, linked from your admin folder in HubSpot, is enough to start.
Set guardrails in the product, not just on paper
Rules that only live in a doc nobody reads will lose to "just ship it" every time the team is under pressure. Put guardrails in the product itself.
Lock down who can create new pipelines and custom objects. Limit who can create new properties — especially dropdowns that affect reporting. Use workflows as a backstop, not a crutch. A few patterns that work for many mid-market teams:
- Validation rules on things like renewal_date and amount so bad data can't get in easily
- Auto-normalization for values that always come in messy (industries, regions)
- Missing-association alerts when critical associations are missing — deals without a company, tickets without a contact
At Pivot, we use the same patterns internally that we recommend to clients. When we introduce a new custom object or property set, we ship the guardrails alongside it. Otherwise the data starts rotting the moment the project ends.
Revisit the model on a predictable cadence
A data model is never "done." New products, new pricing, and new motions will stress whatever you designed last year. The mistake is waiting until you're in pain to look at it.
Pick a cadence that matches your change velocity. For many B2B mid-market teams, a light-touch quarterly review is enough:
- Scan for unused properties (Property Insights makes this fast)
- Review new requests for objects or pipelines
- Look at a few key reports for signs of strain — like manual exports to Excel for basic questions
When the review surfaces real friction — finance can't reconcile bookings, customer success can't see implementations by region — that's usually the trigger to step back and do a focused data architecture project. That might be a good moment to bring in outside help, whether it's us or someone else. This is the kind of work we do week in, week out for RevOps and technical owners who inherited a messy portal: Data Architecture & Analytics.
If you do nothing else after reading this, spend 60 minutes inside Property Insights. Export your top-used properties, highlight which ones you've actually touched in the last quarter, and circle the ones nobody can explain. That hour will tell you more about your real data model than any glossy diagram.
